
7 Best Crypto Mining Containers for Global Buyers
Buying a mining container is not simply a matter of choosing a steel box. It means matching power capacity, cooling design, rack layout, and site conditions to a specific fleet. A container built for a cool, dry site may need different airflow and filtration in a humid or dusty location. Small design details matter.
The Cambridge Centre for Alternative Finance’s 2023 Digital Mining Industry Report estimated that surveyed Bitcoin miners used an energy mix that was 52.6% sustainable, including 37.6% renewables and 15% nuclear. These figures describe the report’s survey, not every mine worldwide. They still underline why buyers should examine power sourcing, efficiency assumptions, and operating conditions—not just advertised capacity. Space matters. So does service access.
Jaran Mellerud, a digital-asset mining analyst and founder of Hashrate Index, has emphasized in his published industry analysis that electricity costs and hardware efficiency shape mining economics. That principle guides this review of Crypto Mining Containers. The seven options should be compared by usable miner capacity, cooling approach, electrical integration, deployment requirements, and support availability. A low purchase price can look attractive, yet freight, installation, and local infrastructure may change the total cost. No single container suits every site. This guide offers a practical starting point, not a promise of returns.
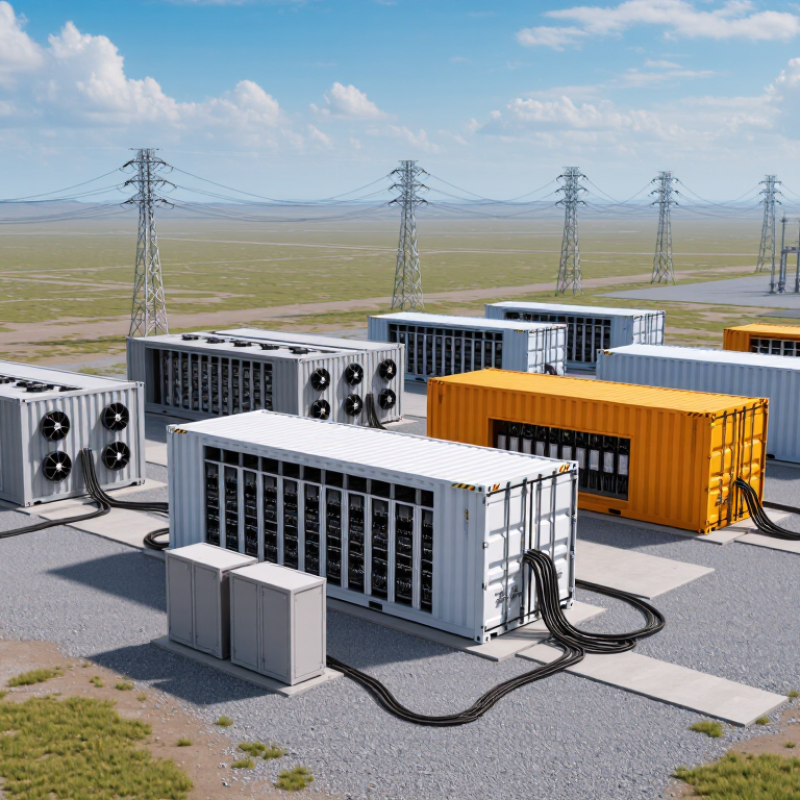
Define Mining-Container Capacity by MW, ASIC Count, and Footprint
A mining container’s capacity should be specified in three ways: electrical load, ASIC count, and site footprint. Cambridge Centre for Alternative Finance’s 2023 Digital Mining Industry Report estimates Bitcoin mining consumed about 120 TWh of electricity that year. That scale makes clear why a “1 MW container” needs a precise definition: it may describe total facility input, not power available to miners.
Use the ASIC’s rated draw to estimate count. If a unit consumes 3.5 kW, a 1 MW total power budget with 85% allocated to miners supports roughly 243 units; the rest covers cooling and other loads. Treat this as a planning estimate, not a guaranteed operating figure. Real draw varies with hardware settings, ambient heat, and cooling design. A small mismatch matters.
Footprint needs equal care. A standard 40-foot container occupies about 29.7 square metres externally, but that is not the full site requirement. Buyers should account for service access, electrical equipment, airflow, and space between units. Ask suppliers to state whether quoted capacity means IT load or total input, and request a layout showing miner positions and maintenance clearance. Global sites differ; local temperatures and grid conditions can change usable capacity. A spreadsheet will not catch every constraint.
7 Best Crypto Mining Containers for Global Buyers - Define Mining-Container Capacity by MW, ASIC Count, and Footprint
| Container Configuration | Typical IT Capacity | Estimated ASIC Count | Container Footprint | Best-Fit Use Case | Key Planning Consideration |
|---|---|---|---|---|---|
| 1. Compact 20-ft module | 0.25–0.35 MW | About 72–116 units | About 14.8 m² (159 ft²) | Pilot deployments, constrained sites, or phased capacity additions. | Allow space for service access and airflow; the container footprint does not include external clearance. |
| 2. Balanced 20-ft module | 0.35–0.50 MW | About 100–166 units | About 14.8 m² (159 ft²) | Sites seeking a smaller transport module with moderate mining capacity. | Confirm the cooling and electrical design can support the selected rack layout and operating climate. |
| 3. 40-ft module, moderate density | 0.60–0.80 MW | About 172–266 units | About 29.7 m² (320 ft²) | Flexible deployments where straightforward maintenance and airflow are priorities. | Verify intake-air conditions, filtration needs, and fan capacity for the local environment. |
| 4. 40-ft module, standard density | 0.80–1.00 MW | About 229–333 units | About 29.7 m² (320 ft²) | Utility-scale projects targeting roughly one megawatt of miner IT load per module. | Check transformer, switchgear, cable, and protection ratings against the full electrical design. |
| 5. 40-ft module, high density | 1.00–1.20 MW | About 286–400 units | About 29.7 m² (320 ft²) | Sites with limited land area and suitable power and heat-rejection infrastructure. | Higher density increases thermal and maintenance demands; confirm performance at local ambient temperatures. |
| 6. Two-module liquid-cooling-ready layout | 1.20–1.60 MW combined | About 343–533 units | About 59.4 m² (640 ft²) for two 40-ft containers | Projects evaluating liquid-based heat management or a modular expansion path. | Include external heat-rejection equipment, liquid distribution, and maintenance access in the site plan. |
| 7. Four-module scalable cluster | 2.00–3.00 MW combined | About 572–1,000 units | About 118.8 m² (1,280 ft²) for four 40-ft containers | Larger sites that need staged installation and capacity growth in repeatable blocks. | Plan for shared substations, site-wide cooling or airflow, fire safety, roads, and container separation. |
How to read these figures: ASIC counts are planning estimates based on miner nameplate power of approximately 3.0–3.5 kW per unit, calculated as IT capacity (kW) divided by miner power. Actual counts vary by hardware, rack arrangement, cooling design, and electrical limits. IT capacity is not the same as total site power; cooling and other auxiliary loads require additional capacity. Footprints use approximate external dimensions for standard 20-ft and 40-ft containers and exclude access aisles, setbacks, transformers, and cooling equipment. Confirm final specifications with the project engineer and local codes.
Related Posts
-
How to Buy a Bitcoin Mining Shipping Container?
-
How to Choose a Bitcoin Mining Shipping Container?
-

7 Essential Tips for Selecting the Best Bitcoin Mining Container Manufacturer Worldwide
-
Ultimate Guide: Comparing the Top Bitcoin Mining Containers Available Globally
-
7 Best Bitcoin Mining Containers to Elevate Your Crypto Game
-
How to Choose the Best Bitmain Container for Your Mining Needs in 2025